In 2013 I co-founded BrightFunnel, a startup building a data and analytics platform startup to provide marketers with insights on campaign performance. Our demo-day tagline was “Splunk for CMOs” though what we would build over the next few years turned out to be a full-fledged cloud-based business intelligence stack. Over 4+ years, we scaled to $5M in ARR, marquee enterprise customers such as SAP Concur and Verizon Telematics as well emerging unicorn companies such as Cloudera, New Relic, Hortonworks and Docker.
The premise of BrightFunnel was simple: marketers’ data was in silos, and this made it hard to get a full picture of marketing impact on revenue. Enter a marketing analytics platform that unifies B2B marketing data into a single data warehouse, enables custom business logic and data governance and displays insights on performance at a channel, campaign and account level. In a nutshell, we aspired to be the “single source of truth” for the entire marketing organization. This was possible due to some heavy lifting on the data platform front, which helped create a unified view of the customer journey and allowed us to run multi-touch attribution on that data.
It’s data pipelines all the way down
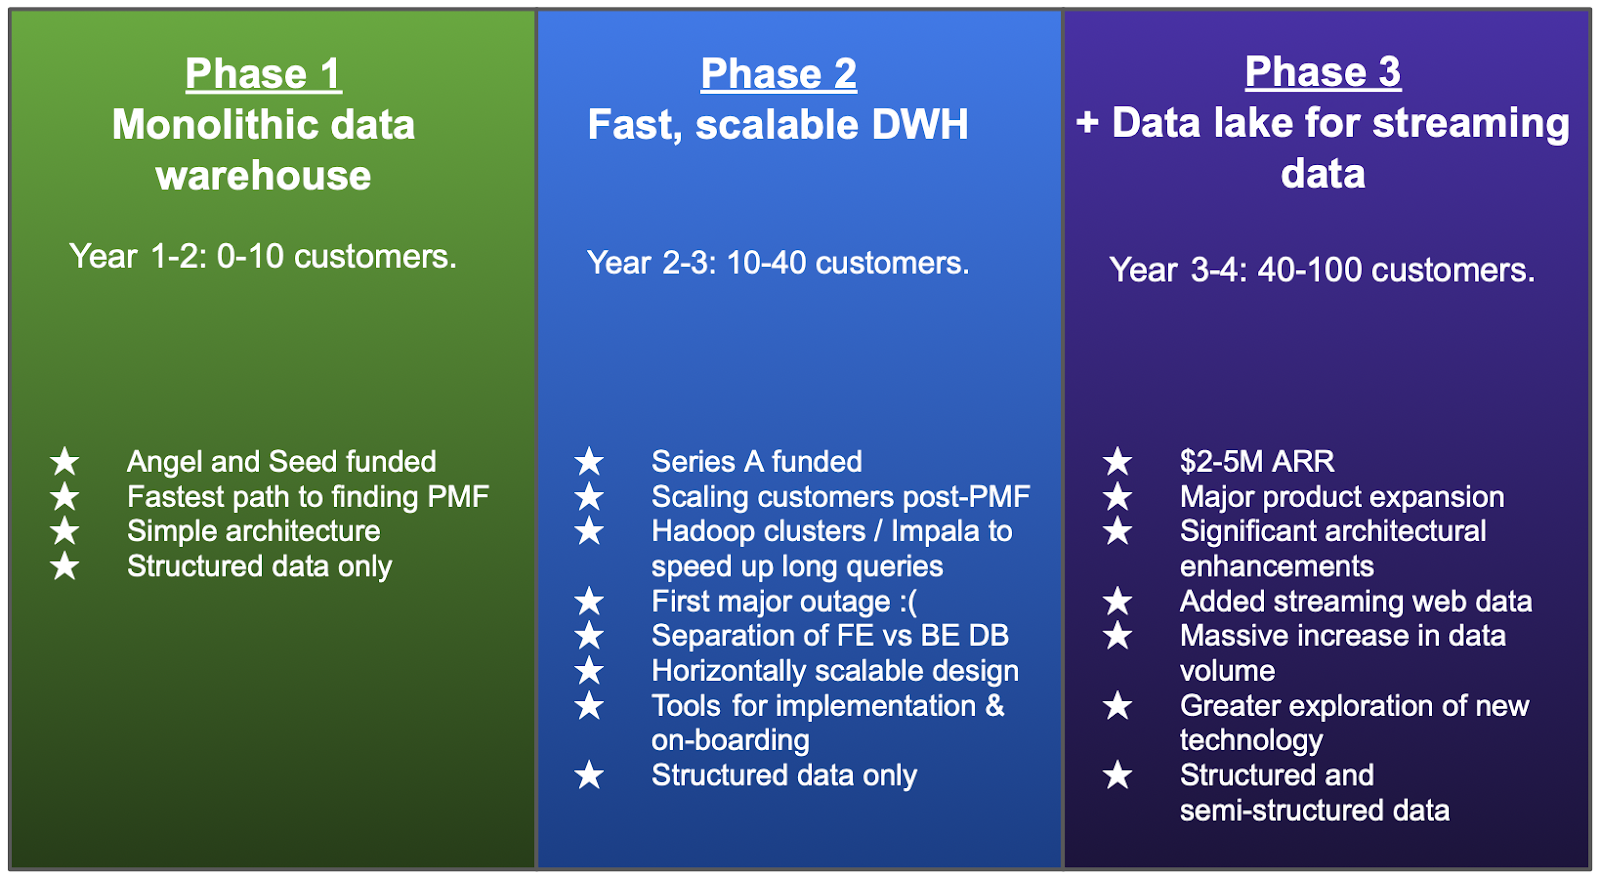
While the vision was compelling, we first first, we had to do some serious data wrangling and data pipeline automation to get there. That’s the focus of this post: I want to reflect on scaling the tech platform. We didn’t foresee when we started that the BrightFunnel platform would evolve through 3 distinct stages, as we scaled from building an MVP with our first 2 beta customers to 100 enterprise customers, paying up to $250k ARR.
Phase 1: Monolithic DWH Architecture (seed funding, year 1-2)
I still remember the joyous feeling of getting our first beta customer to input their Salesforce OAuth credentials -- gosh can it be this easy?! Calling it beta is a stretch - we had a few data tables in our UI and were computing some basic summary stats. But getting our hands on a real company’s data was like watching a deflated bouncy castle fill with air and take shape.
From these humble beginnings, we signed up 2 more beta customers -- we later renamed them design partners -- and from there, added our first 10 paying customers, including those first three. We had hypothesized that we could actually go quite far towards our vision with a single data source in Salesforce and this turned out to be the case even more so than expected.
From raw to canonical data
The initial barriers were less about combining data sources and more about transforming existing Salesforce data into a usable form for attribution graph calculations. We ingested a customer’s Salesforce data tables -- pretty much all of them -- in raw format and transformed them into canonical format, consistent across all of our customer orgs. This data then went through one more refinement step to get it ready for analytics queries from our application.
This design pattern of refining raw data into more value-added forms is common in BI applications, it turns out -- but as a founding team with lots of customer empathy and domain expertise, but none of it in analytics -- it was a novel discovery for us. And over time it turned out that by offering customers a way to manage their data for purposes of marketing reporting, we provided a valuable service that paved the way to our product-market fit.
Relying on SQL for data transforms
One of the early architectural decisions we made was to make many necessary computations to transform the data within the database itself, as SQL stored procedures. Keeping the logic close to the data had some advantages, though as expected, there were some longer term trade-offs.
Phase 2: Optimized DWH (Series A, years 2-3)
The second phase started around the time of our Series A round, which is to say 2-3 years into our journey. At this point we had established product-market fit with a healthy base of paying, loyal customers, and had raised $6M on the back of the likelihood that there were many more such customers, and that it would be a rapidly growing cohort.
With welcome customers scale came some new technical challenges. Our attribution graph calculations had gotten quite complex, and this caused our data cycle to peak at around 12 hours, with roughly 15-20 customers. This increased from a previous cycle time of 1-2 hours. This was due to the fact that we had more customers, that our newer customers had much more data and that our attribution rules had become more nuanced. On the latter point -- one of the core problems we solved for customers was to identify possible marketing campaigns that influenced pipeline or revenue. To do so, we traced a path from Campaigns (where cost was attached) to Campaign Members (people) to Contacts to Accounts and finally to Opportunities (where revenue or pipeline was attached). We even did this where the influenced person was a Lead without any explicit Account or Opportunity association, with something we named the Orphan Lead Finder (fuzzy logic to match then to their rightful parent account).
Setting up Hadoop clusters with Impala
This was all very exciting -- in fact we filed a patent on the attribution methodology -- but computationally expensive. We processed customers’ data sequentially, with a monolithic architecture, which led to every customer experiencing a slowdown as we added more customers. At this point we knew we had to tackle this issue. We chose to set up Hadoop clusters, on which we ran the Impala service to crunch our longest queries, which we offloaded from mySQL to Impala. This sped up the compute in our data warehouse, and our data cycle time came down to 4-5 hours.
Alternatives considered: pure MapReduce, graph databases, and Snowflake
We considered taking a pure MapReduce on Hadoop approach, rather than using Impala. The trade-off was that if we didn’t have Impala running as a service on Hadoop, we would have needed to write more Java to re-implement some SQL logic. Both my co-founders were adept with Java so it wasn’t a familiarity or skill-set issue. Rather, it was attractive to not spend time recreating what already existed -- potentially adding new instabilities -- by taking advantage of Impala’s SQL compatibility.
We also considered whether using a graph database might offer some optimization opportunities. Since the bulk of our compute was calculating graph relationships, in theory, this made a lot of sense to explore. However, the data we ingested was relational, and would have to be transformed into the graph format first. Secondly, it would cost resources without adding new customer-facing capabilities. Another intriguing technology that one of my co-founders introduced to me in late 2014 was Snowflake. There were many compelling reasons to have chosen them, but ultimately, betting the company on another startup was not something we wanted to do at the time.
So we opted not to change our architecture dramatically. It was simply a reality of this phase of growth that we were more or less wedded to some foundational decisions we had made, not because they were impossible to change, but because the opportunity cost, in terms of enabling customer growth while maintaining stability, would be too great.
Horizontal scalability with a pod architecture
Besides making our monolithic architecture run faster, we knew that we needed to make our data platform horizontally scalable. This was a significant change, but this was an investment we chose to make in order to set us up for future growth. We created multiple pods, which accommodated roughly 25 customers each.
Separating front-end and back-end data processing
In this phase we also decided to add a dedicated mySQL database for our web tier, distinct from the backend mySQL database. As sometimes happens with these sorts of decisions at data and analytics companies, we made this change after an outage. We initially had one instance of each, and subsequently scaled the backend to 4 servers.
Building tools for implementation engineers
By this point, we had discovered the hard way that setting a customer up so they could see rapid time to value was critical. An early failure mode was we would ingest all of a customer’s data, and call that a job well done. But as the customer started using our application, we discovered new things about their use cases, such as: “oh yeah, we don’t use the standard ‘revenue’ field at all. We have this custom field that does that for us. So we can’t yet use your product to present to the Board after all.” With enough such at-bats, we assembled a fool-proof set of questions to ask customers in order to configure our platform correctly.
With this knowledge in hand, we spent some engineering cycles to make it as easy as possible for our implementation engineers to set up a customer. Our implementation engineers were capable software developers, but with some automation, they could handle a lot more customers. Previously, we asked customers: “ok, tell me how you want your system setup to do attribution!” and we were predictably greeted with crickets by all except the most advanced Marketing Ops teams.
We also found that we could make our analytics platform more valuable by implementing features such as dynamic filters. These were created using customer-defined rules, which made it quite powerful to slice and dice the data in a manner consistent with business goals (e.g. “Filter by Tier 1 target accounts for this fiscal year”).
In this second, post PMF phase, we had grown our team, knew what customers wanted, had greater clarity on our strategy and were scaling our go-to-market operations. As such we needed to not only speed up the data cycle and make the platform horizontally scalable, but we also needed to improve our implementation and setup tools.
Phase 3: Data Lake for Streaming Data (years 3-4)
Our final phase was ushered in by an important enhancement to our value proposition. We had initially been focused on analyzing data from significant conversion events in the B2B funnel (such as form completes). The market had matured to a point where our target users valued more granular data such as website visits.
The popularity of account-based marketing
And increasingly, our customers were adopting account-based marketing (ABM) strategies, which entailed putting greater emphasis on engagement of accounts determined to be valuable a priori, versus only valuing campaign interactions ex post, if they were associated with accounts with influenced pipeline or revenue. This trend played directly into our strengths as a data platform and we were able to quickly launch a product module to better serve this use case.
Collecting web event data
Within this context, it made perfect sense for us to make a major enhancement to our practice of relying on structured data from software systems such as Salesforce, Marketo (now Adobe) and Eloqua (now Oracle). Our credibility with customers had also skyrocketed. This allowed us to ask our customers to install our JavaScript snippet on their web properties. And many of our existing customers enthusiastically said yes; new customers almost unanimously adopted the new approach, which entailed the management of an order of magnitude more data, and some tricky judgment calls for governing that data.
NoSQL: adjusting to allow semi-structured and unstructured data
As a result of this new type of data we collected directly from our customers -- instead of mediated by other applications -- we had to revisit our data schema to accommodate not only structured data, but also semi-structured data from JSON snippets.
We initially implemented Amazon’s DynamoDB as a key-value store for looking up data from JSON snippets received from customer websites. The data would flow from customer websites to an Amazon API gateway, and then a Lambda function would store the data in DynamoDB. Because mySQL was always the source of truth, we had to sync aggregate data from DynamoDB into mySQL.
Apache Spark, Kinesis, S3 and Athena for real-time data processing
As our data exploded, we further adapted our design. We landed on storing the data in S3, which we concluded -- as many others have done -- made for a very capable and cost-effective data lake. The data made its way to S3 via Amazon Kinesis, which provided us with a window into the real-time data stream of customer web snippets.
But as customers’ web event activity data pipeline grew rapidly, it was taking our system 24 hours to process all the events received daily. This made the data tremendously less valuable to our customers. It was potentially an existential threat. We surmounted this challenge with the help of Apache Spark. Using Amazon EMR, we spin up machines for running Spark clusters to process web activity data in S3 and write the aggregate statistics in mySQL. This was a significant parallel data processing challenge, and Spark performed admirably in this task. We also found it useful to implement Amazon Athena, which gave us SQL querying facility on top of our S3 data. This was very useful for our product managers and our business analyst in particular, who could solve customer problems or gain insights faster by being able to query our S3 data lake in addition to our mySQL database.
Delighting users while improving data cycle from 24 to 3 hours
Through the above combination of improvements, we reduced our data cycle time for web events from 24 hours to 3 hours, and did so while unlocking new functionality for our customers.
Conclusion
We were successful in evolving BrightFunnel’s data and analytics platform to the changing scale of the business as well as the needs of the marketplace. We were doing this in the period 2013-2017, when Amazon Web Services expanded rapidly, and we benefited from adopting many of these services. Moreover, foundational technologies, such as Apache Spark, were gaining traction, allowing us to solve some of our thorniest problems. But despite our focus on data and analytics, many of our biggest decisions could not be easily answered with data. In building products in highly dynamic environments, especially when trying to create a new category while solving novel technical problems, there are always tensions such as growth vs stability or exploring new approaches vs exploiting existing ones. Navigating these uncertainties is ultimately one of the most challenging things about building a startup or managing any new product, but also one of the most rewarding.
Note: The above reflects on the work of the entire BrightFunnel team, and all the credit goes to them, in particular my co-founders, Nisheeth Ranjan and Ranjan Bagchi. In fact, the foregoing resulted directly from multiple conversations with the two of them. Any mistakes or omissions are mine alone.